 Image credit: Unsplash
Abstract
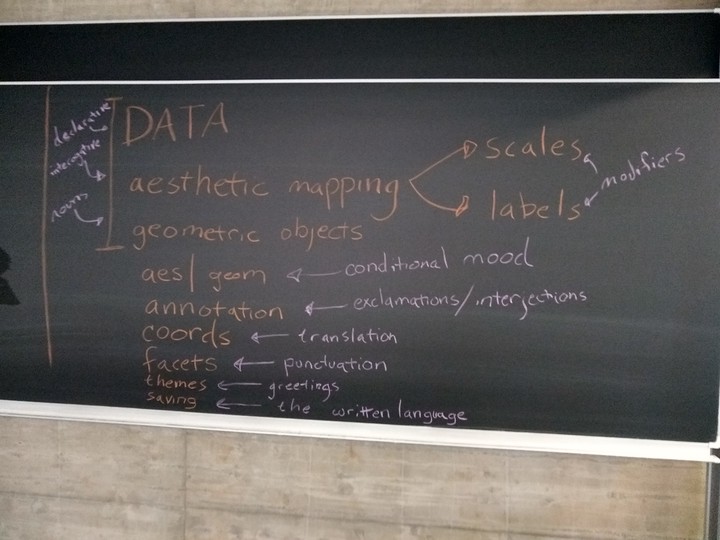
ggplot2 is an implementation of the “grammar of graphics” for R. The grammar of graphics is a framework that enables users to go beyond predetermined chart types by mapping variables of a dataset to the aesthetics characteristics of geometric objects, giving users greater expressive freedom. The grammar of graphics tool gives the user the control to build nearly any chart that she imagines.
Date
Jul 18, 2019 1:00 PM — 2:30 PM
Event
Talk
Location
Max Planck Institute for Biology, Dresden
Max Planck Institute for Biology, Dresden, Saxony, 01099, Germany