First Blogdown blogpost
This is my first post just a test of blogdown.
It seems to be working fine also with this R code.
x = 5
x^2
## [1] 25And this Python code:
print("hello" + "there")## hellothereLet’s check out how a graph looks too:
library(ggplot2)
ggplot(mtcars) +
  aes(mpg, disp, col = as.factor(cyl)) +
  geom_point()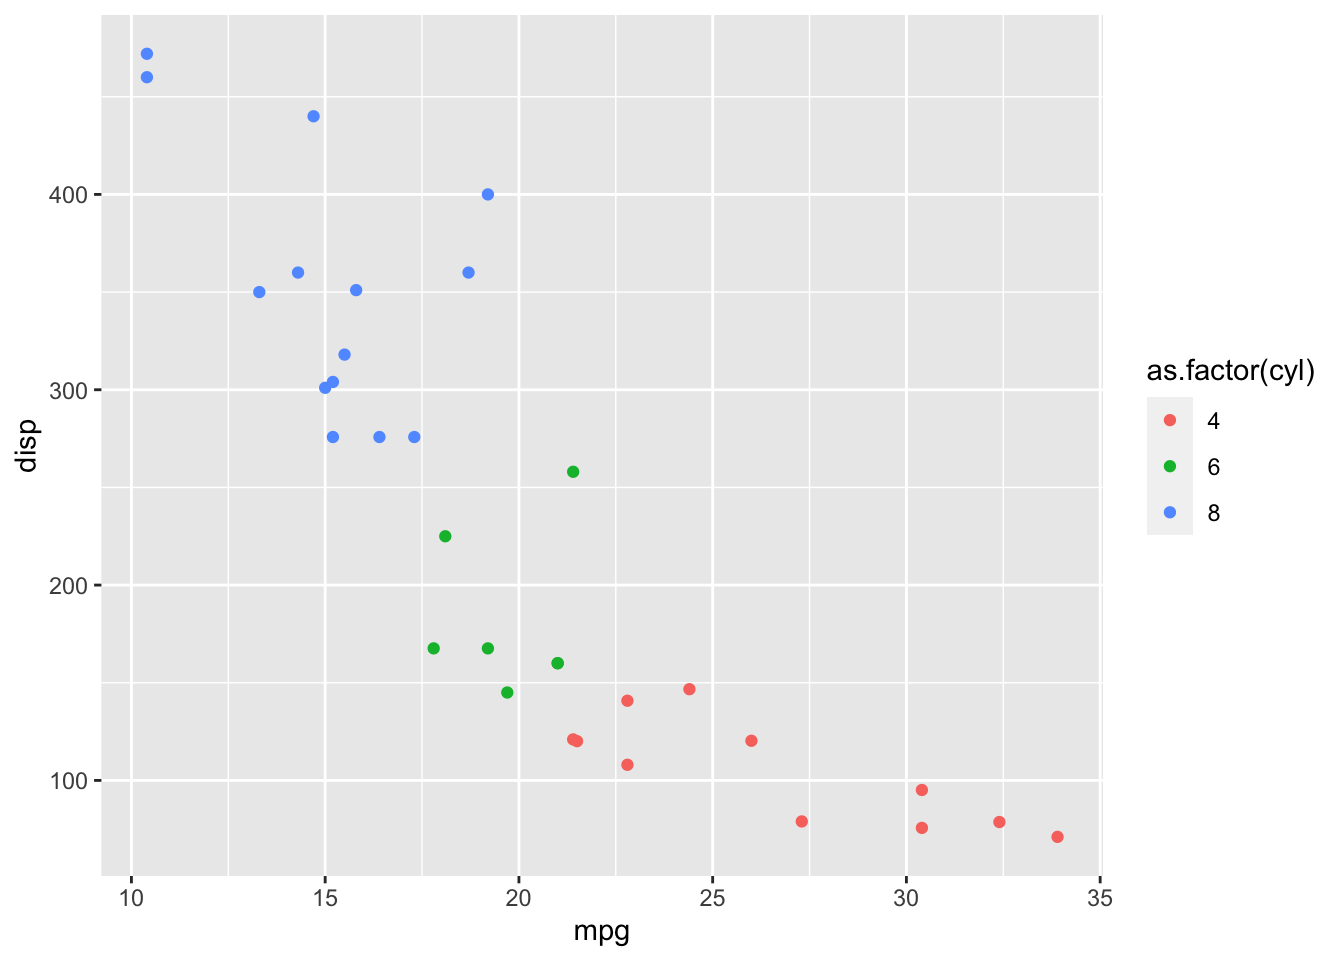
Looks good. I’m very satisfied. Hooray for blogdown!